
A sportsbook lists the Toronto Maple Leafs at −110 to beat the Montreal Canadiens. Another offers −125 for the same outcome. Which price is better is obvious. Whether either price represents good betting value is a much more interesting question.
That is where a prediction app can help.
With ChatGPT, publicly available hockey statistics and a relatively simple statistical model, you can build an application that estimates NHL win probabilities, compares them with sportsbook odds and identifies potential pricing discrepancies.
The process is particularly relevant to Canadian hockey fans following teams such as Toronto, Montreal, Edmonton and Vancouver. However, the same approach works for any NHL matchup, regardless of where the bettor lives.
In this tutorial, we’ll build an NHL Value Finder, a browser-based application that combines team statistics, goalie performance, expected goals and American betting odds.
All monetary examples use US dollars.
The objective is not to create an automated system that guarantees winning bets. It is to build a transparent analytical tool that can be tested, challenged and improved.
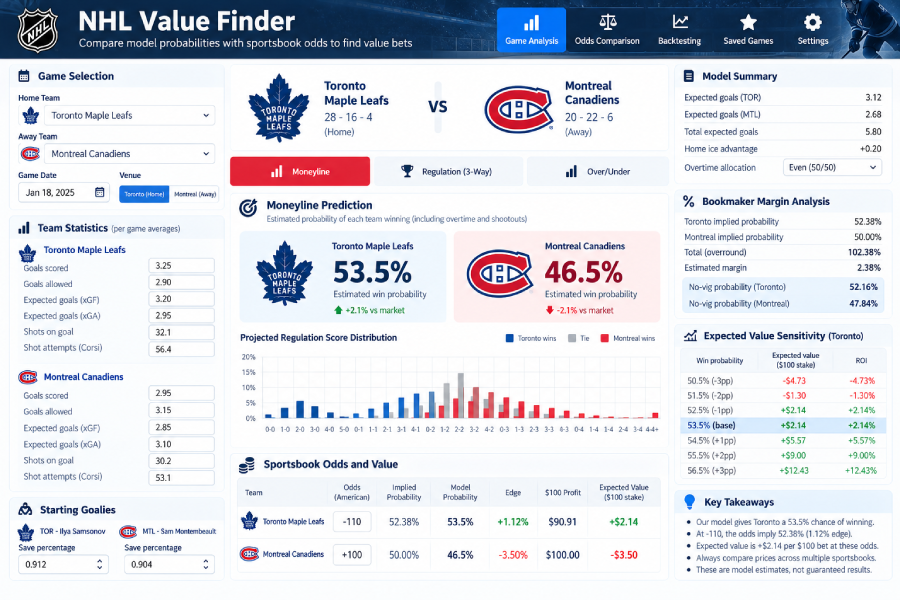
Step 1: Define What the NHL Value Betting App Should Do
Before writing code, decide what the application needs to accomplish.
Our NHL Value Finder will perform five tasks.
First, it will allow users to select two NHL teams and identify the home and away sides.
Second, it will accept team and goalie statistics, including goals scored, goals allowed, expected goals and save percentage.
Third, it will use those inputs to estimate the probability of each team winning.
Fourth, it will convert sportsbook odds into implied probabilities and compare those figures with the model’s estimates.
Finally, it will calculate the hypothetical expected value of a $100 wager.
Start a new ChatGPT conversation and enter this prompt:
“Build a responsive web application called NHL Value Finder using React and TypeScript. The application should allow users to select any two NHL teams, identify the home team and enter statistics for both sides.
Create sections for team performance, starting goalies, predicted win probabilities, sportsbook odds and estimated betting value.
Use a professional hockey analytics dashboard design with navy blue, white and ice-blue colours. Add clear input labels, accessible controls and mobile-friendly layouts.
Do not fabricate current NHL statistics or sportsbook prices. Use clearly labelled demonstration data until real information is supplied.”
ChatGPT should generate the basic interface and supporting code.
At this point, the app will not make meaningful predictions. It will simply provide the structure needed for the statistical model.
Step 2: Gather the Hockey Statistics
The accuracy of any prediction model depends heavily on the quality of its inputs.
For NHL games, a useful starting dataset includes goals scored and allowed per game, expected goals for and against, shot generation, shot suppression, goalie save percentage and home-ice advantage.
Expected goals, usually abbreviated xG, attempt to estimate the quality of scoring opportunities rather than counting every shot equally.
A team producing many low-quality shots may have a less threatening offence than one generating fewer but more dangerous opportunities.
Useful research sources include NHL.com, NHL EDGE and hockey analytics databases that publish expected-goals statistics.
For our hypothetical Toronto–Montreal matchup, the application might use the following figures:
| Statistic | Toronto | Montreal |
| Goals scored per game | 3.25 | 2.95 |
| Goals allowed per game | 2.90 | 3.15 |
| Expected goals for per game | 3.20 | 2.85 |
| Expected goals against per game | 2.95 | 3.10 |
| Starting goalie save percentage | .912 | .904 |
| Home team | Yes | No |
All figures are invented for demonstration purposes and do not describe current team performance.
Once the dashboard exists, ask ChatGPT:
“Add editable fields for goals scored per game, goals allowed per game, expected goals for, expected goals against and starting goalie save percentage.
Allow users to enter the data manually or import a CSV file.
Validate all numerical inputs and display a warning when information is missing. Include a source and date field so users can identify when each statistic was collected.
Do not generate predictions when essential inputs are missing.”
For an initial version, manual data entry is enough.
Connecting to a sports statistics API can come later, once the model works and its assumptions have been tested.
Step 3: Estimate Each Team’s Expected Goals
The next challenge is converting the statistics into a prediction.
One possible starting approach is to estimate each team’s expected scoring rate using its offensive production and the opponent’s defensive performance.
For example, the model could combine Toronto’s expected goals for with Montreal’s expected goals against, then adjust the result for the starting goalies and home-ice advantage.
These adjustments must be explicitly defined.
A simple arithmetic average is easy to understand, but it does not automatically produce an accurate model. Goalie statistics can also overlap with team defensive performance, creating a risk of counting the same influence twice.
For a beginner’s prototype, we can model regulation scoring with Poisson distributions.
The Poisson distribution estimates the probability of a particular number of events occurring when an expected rate is known.
In hockey, it can be used as an approximation for the number of goals a team scores during regulation.
Ask ChatGPT:
“Create a transparent expected-goals model for NHL games.
Use team offensive and defensive statistics to calculate each side’s expected regulation goals. Include optional adjustments for starting goalie performance and home-ice advantage.
Make every adjustment and weighting visible to the user.
Use a Poisson distribution to estimate regulation score probabilities from 0–0 through 10–10, and include a method for accounting for the remaining probability beyond that range.
Explain that the Poisson model is a simplified approximation and that its parameters require historical validation.”
The result should be a probability distribution showing the likelihood of different regulation scores.
However, this is not yet a complete NHL moneyline model.
Unlike many football competitions, NHL games do not finish tied. Overtime and shootouts must be accounted for separately.
Step 4: Calculate NHL Moneyline Win Probabilities
Suppose our model estimates the following regulation outcomes for a fictional Toronto–Montreal game:
Toronto wins in regulation: 42%.
Montreal wins in regulation: 35%.
Game tied after regulation: 23%.
Those three outcomes total 100%.
For a standard NHL moneyline market that includes overtime and shootouts, the model must distribute the 23% regulation-tie probability between the two teams.
As an initial assumption, we might allocate overtime and shootout wins equally.
Toronto would then receive an additional 11.5 percentage points, bringing its overall estimated win probability to 53.5%.
Montreal would receive the other 11.5 points, producing a 46.5% probability.
These are hypothetical figures, not a prediction of an actual game.
A more advanced model could estimate overtime and shootout probabilities using relevant historical information, although the resulting improvement would need to be tested.
Use this prompt:
“Add an NHL Moneyline Prediction section.
Calculate each team’s regulation win probability and the probability of a regulation tie from the existing score distribution.
For the initial model, split the probability of a regulation tie equally between the teams to represent overtime and shootout outcomes.
Display the resulting full-game moneyline probabilities, ensuring they total 100%.
Make the overtime allocation assumption visible and editable. Do not confuse three-way regulation betting with standard two-way NHL moneyline betting.”
This distinction is essential.
Some sportsbooks offer three-way regulation markets, while others offer two-way moneylines that include overtime and shootouts.
The app must identify which market its predictions apply to before comparing prices.
Step 5: Convert Sportsbook Odds Into Implied Probability
Once the app estimates each team’s chance of winning, the next task is to understand the sportsbook’s price.
American odds express potential returns relative to a $100 reference stake.
Negative odds indicate how much must be staked to win $100. Positive odds indicate the profit from a successful $100 bet.
For example:
| American odds | Implied probability | Profit on a winning $100 bet |
| −110 | 52.38% | $90.91 |
| −125 | 55.56% | $80.00 |
| +110 | 47.62% | $110.00 |
| +150 | 40.00% | $150.00 |
For negative American odds, implied probability is calculated as:
Absolute odds ÷ (Absolute odds + 100)
For positive odds, the calculation is:
100 ÷ (Odds + 100)
Now suppose Toronto has a model-estimated 53.5% chance of winning and a sportsbook offers −110.
The bookmaker’s price implies a 52.38% probability.
The difference is approximately 1.12 percentage points.
That does not guarantee a profitable bet. It simply means the model estimates a higher probability than the break-even probability implied by the price.
Ask ChatGPT:
“Add an American odds converter to NHL Value Finder.
Allow users to enter positive or negative American odds. Convert them into decimal odds and implied probability.
For each selection, compare the bookmaker’s implied probability with the model-estimated win probability.
Display the difference in percentage points, the profit from a successful $100 bet and the expected value of a $100 wager.
Validate the odds inputs and do not treat a positive probability difference as guaranteed profit.”
This is the central feature of the application: identifying differences between the model’s estimate and the price offered by the sportsbook.
Step 6: Account for the Bookmaker’s Margin
Sportsbooks generally build a margin into their prices.
Suppose a bookmaker offers Toronto at −120 and Montreal at +100.
The implied probabilities are approximately 54.55% and 50%.
Together, they total 104.55%.
The additional 4.55 percentage points represent the market’s overround, commonly associated with the bookmaker’s margin.
One simple way to estimate the market’s underlying probabilities is to divide each implied probability by the sum of both.
That produces approximately 52.17% for Toronto and 47.83% for Montreal.
This proportional adjustment is a modelling convention. It does not reveal the bookmaker’s true beliefs, and alternative margin-removal methods can produce different estimates.
Ask ChatGPT:
“Add a Bookmaker Margin section to the odds comparison panel.
When users enter both sides of a two-way NHL moneyline market, calculate the combined implied probability and the overround.
Estimate no-vig probabilities using proportional normalisation.
Display the original implied probabilities, the overround and the adjusted no-vig probabilities.
Explain that no-vig probabilities are estimates derived from market prices, not objective measures of the teams’ actual chances.”
The no-vig comparison helps users understand how a bookmaker prices both sides of a game.
However, expected value should still be calculated using the actual odds available for the wager.
Removing the margin from the displayed probabilities does not remove it from the sportsbook’s payout.
Step 7: Calculate Expected Value for a $100 Bet
Expected value, or EV, measures the average theoretical return of a wager if the model’s probabilities are accurate.
For a $100 stake, the calculation is:
EV = (Win probability × Winning profit) − (Loss probability × $100)
Return to our hypothetical Toronto example.
The model estimates a 53.5% win probability.
The sportsbook offers −110, paying approximately $90.91 profit on a successful $100 wager.
The calculation becomes:
EV = (0.535 × $90.91) − (0.465 × $100)
The result is approximately +$2.14 per $100 staked.
That represents a theoretical ROI of about 2.14%.
It is important to distinguish this from the probability edge of approximately 1.12 percentage points. They measure different things.
The calculation assumes the model’s 53.5% estimate is accurate.
If the true win probability is lower, the apparent advantage could disappear entirely.
Use this prompt:
“Create an Expected Value Calculator that uses the model-estimated probability and actual sportsbook odds.
Calculate expected profit or loss for a user-defined stake, with $100 as the default.
Show probability edge in percentage points, expected profit in dollars and expected ROI as a percentage.
Use the correct American odds payout formula and display negative expected values clearly.
Add a sensitivity analysis showing how the result changes when the model-estimated win probability is one, two or three percentage points higher or lower.”
The sensitivity analysis is especially valuable.
A selection showing a small positive EV may become negative with only a minor change in the model’s estimated probability.
That should make readers more cautious about treating narrow discrepancies as reliable opportunities.
Step 8: Compare NHL Odds Across Multiple Sportsbooks
A prediction model is more useful when it can compare prices from several sportsbooks.
Suppose Toronto is available at the following hypothetical odds:
| Sportsbook | Toronto moneyline | Implied probability |
| Sportsbook A | −110 | 52.38% |
| Sportsbook B | −120 | 54.55% |
| Sportsbook C | −125 | 55.56% |
If the model estimates Toronto’s chance of winning at 53.5%, only the −110 price produces a positive expected value under that assumption.
The same prediction can therefore lead to different evaluations depending on the price.
For Canadian bettors, this comparison should be limited to sportsbooks available in their province. Operators, betting markets and promotional conditions are not necessarily identical across jurisdictions.
Canadian sportsbook resources such as GambleOnline.ca can provide additional context when researching betting platforms and their available features.
To add the comparison feature, ask ChatGPT:
“Build an NHL Sportsbook Odds Comparison table.
Allow users to enter moneyline odds from at least five sportsbooks for the same game and market.
For each sportsbook, calculate implied probability, expected value, expected ROI and the profit from a winning $100 wager.
Rank prices from most favourable to least favourable for the selected team.
Include fields for sportsbook name, jurisdiction and timestamp. Never invent live odds, and do not compare prices from different settlement markets as if they were equivalent.”
Recording the time matters because NHL odds change.
A price available several hours before puck drop may no longer exist when a user attempts to place a bet.
Step 9: Backtest the App Against Historical NHL Games
At this stage, the application can generate predictions and compare them with sportsbook prices.
But there is still no evidence that its probability estimates are reliable.
Backtesting is necessary before drawing conclusions about the model’s usefulness.
Choose a historical NHL season and collect the statistics available before each game, the closing moneyline odds and the final result.
Then ask the model to generate predictions without access to information that became available after the game began.
This last requirement is critical.
Using end-of-season statistics to predict games played earlier in that same season creates data leakage and can make the model appear more accurate than it really is.
Ask ChatGPT:
“Create a Backtesting section for NHL Value Finder.
Allow users to upload historical NHL game data containing pregame team statistics, goalie information, moneyline odds and final results.
Generate predictions using only information available before each game.
Evaluate probability calibration, Brier score, log loss and hypothetical betting ROI.
Compare the model against a baseline derived from historical no-vig market probabilities.
Use chronological training and testing periods. Prevent future data from entering earlier predictions, and report the number of bets, sample size and uncertainty around the results.”
A profitable historical test does not guarantee future performance.
But a model that repeatedly performs worse than a simple sportsbook-based baseline is unlikely to justify much confidence.
Step 10: Improve the Model Without Overcomplicating It
The first version of NHL Value Finder will have limitations.
A Poisson scoring model may not adequately capture the relationship between team scoring rates, game situations and overtime outcomes.
Starting goalie uncertainty can also materially affect projections.
Other potentially useful inputs include rest days, travel schedules, special-teams performance, injuries and changes in team lineups.
However, adding more statistics does not necessarily improve accuracy.
Each additional variable creates opportunities for overfitting, particularly when the historical dataset is small.
For the final development step, enter:
“Review the NHL Value Finder prediction model as an independent statistical analyst.
Identify weaknesses in the expected-goals calculations, Poisson assumptions, goalie adjustments and overtime modelling.
Recommend improvements in order of likely usefulness.
For each improvement, explain what additional data is needed, how it changes the calculations and how to test it against historical games.
Do not claim improved accuracy unless the new model performs better on unseen data.”
This turns ChatGPT into a development assistant and model reviewer rather than an unquestioned source of predictions.
What the Finished NHL Value Finder Should Display
The completed application should provide a clear workflow.
A user selects Toronto versus Montreal, enters current team and goalie statistics, and generates a model-based probability estimate.
The app then displays regulation scoring projections, full-game moneyline probabilities and the assumptions used to account for overtime.
Next, the user enters sportsbook odds.
The dashboard converts those prices into implied probabilities, calculates bookmaker margin and compares each offer with the model’s estimate.
Finally, the app displays the estimated edge, expected value and hypothetical payout for a $100 wager.
A separate backtesting section allows the user to investigate whether the model’s historical probabilities have been accurate and whether apparent betting opportunities persisted outside the development sample.
The most important feature is transparency. Every number should be traceable to an input, calculation or clearly labelled assumption.
Can ChatGPT Actually Find Mispriced NHL Odds?
ChatGPT can help build a hockey analytics application, write probability calculations, organise historical data and identify weaknesses in a model.
It cannot guarantee that a sportsbook has made a pricing mistake.
Bookmakers have access to extensive information, sophisticated pricing systems and continuously changing markets.
A model-estimated edge may reflect a genuine pricing discrepancy, but it may just as easily reflect missing data, an unrealistic assumption or an inaccurate probability estimate.
For NHL fans, the value of building this app lies in learning how predictions, betting prices and statistical uncertainty interact.
Whether you’re analysing a Maple Leafs–Canadiens rivalry game or an Edmonton Oilers matchup, the same principle applies: a good prediction and a good betting price are not necessarily the same thing.
The NHL Value Finder provides a structured way to investigate that difference, rather than relying on intuition or accepting a prediction at face value.
About the Author
GambleOnline.ca is an independent online gambling media website founded in 2008, publishing experience-based reviews, guides and analysis of online casinos, sportsbooks and poker platforms. Its editorial team conducts hands-on testing and research to provide factual, player-focused insights, alongside educational content on gambling strategy, legality and responsible play.